Google Sheets Course: Filter and Filter View
Filter
Adding a filter allows you to display data based on one or more criteria.
The test data: lesson-10b.xlsx
To add a filter, select the data range (here, columns A to G) and then click on "Create a filter" in the Data menu:

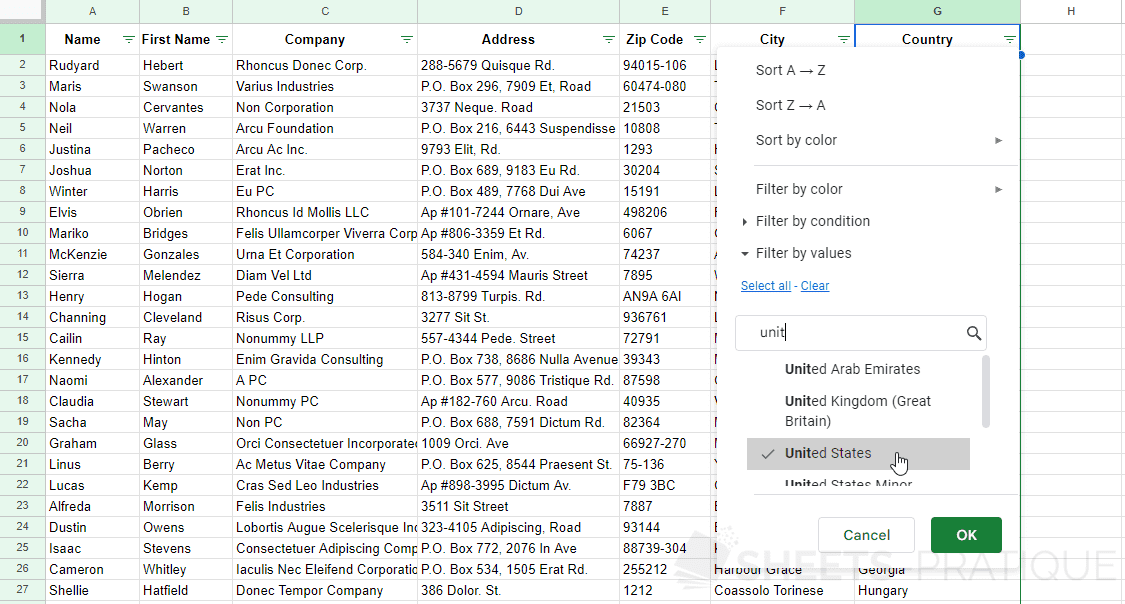
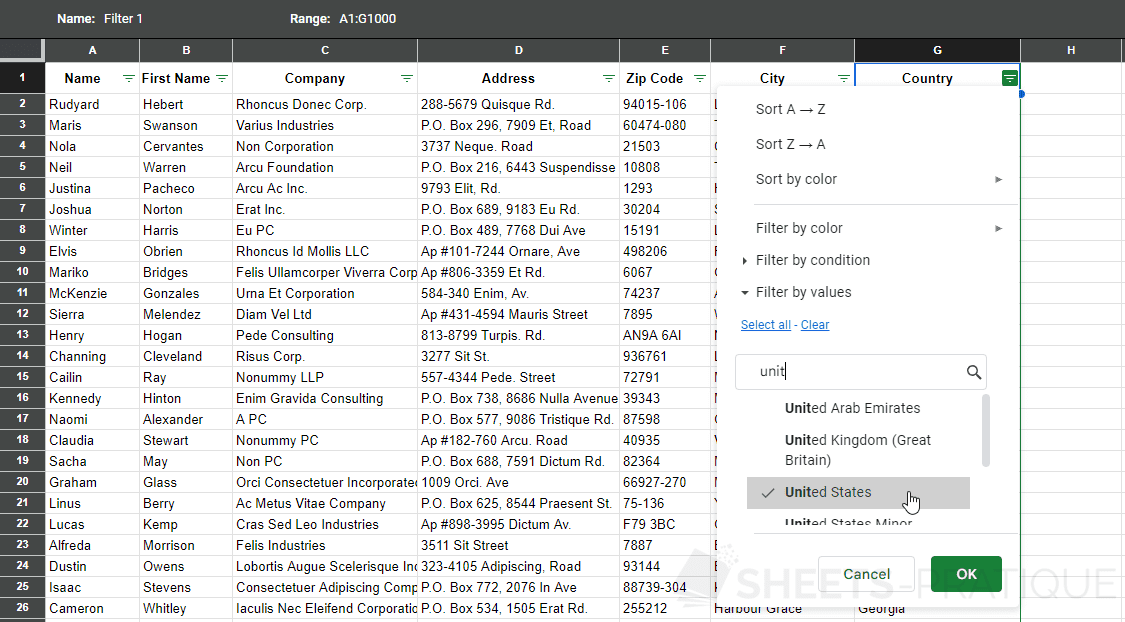
Then click on to the right of each header to define the desired display criteria (here, display of people whose country is "United States"):
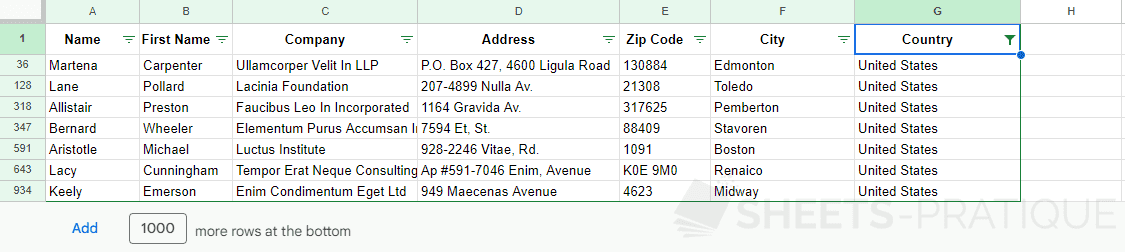
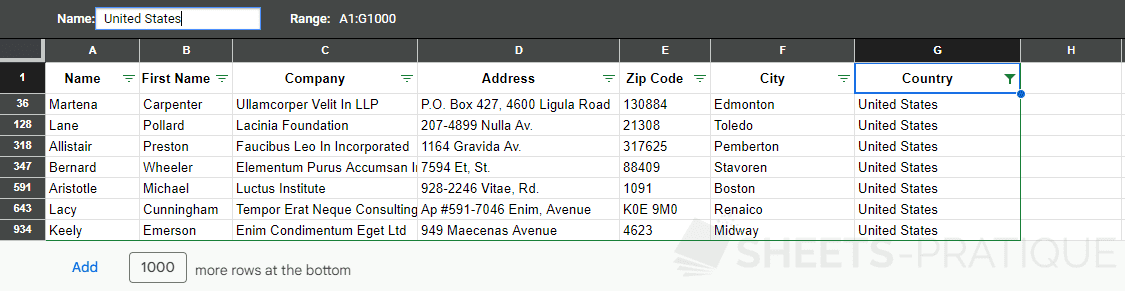
Only data that meets the set criteria will then be displayed:
Filter view
Just like the filter, the filter view allows you to filter data, with a few differences...
The filter view allows other users who are viewing the sheet to be able to switch views to view the data differently (unlike the filter where the display is fixed for read-only users).
This mode also allows you to create multiple different views and name them so you can then display and leave these views very easily.
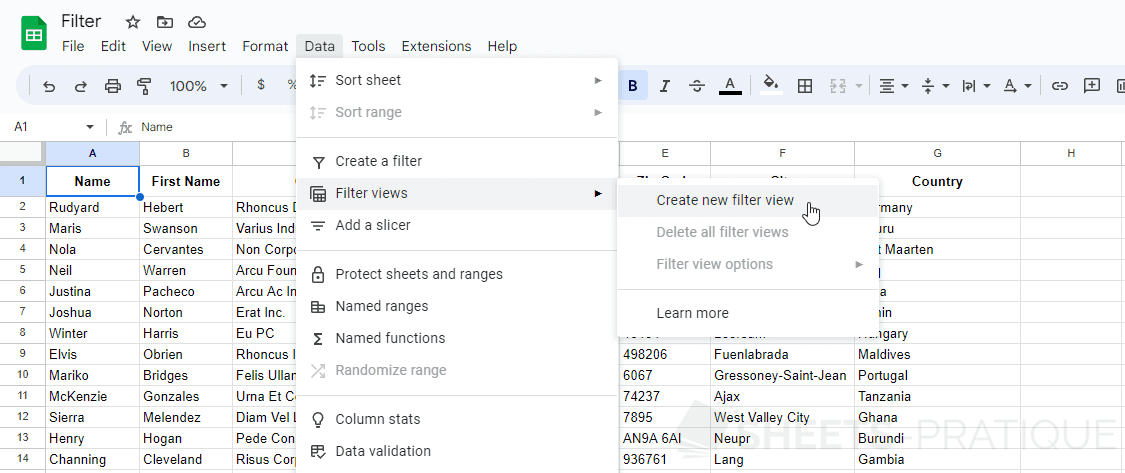
To create a filter view, click on "Filter views" > "Create new filter view" in the Data menu:
Then set up the display as for the filter:
And name this view:
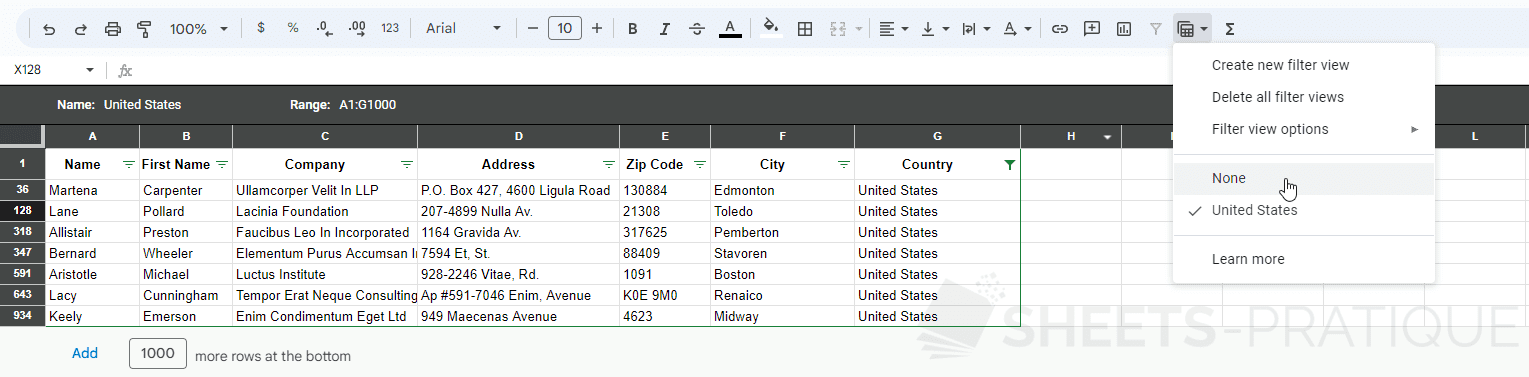
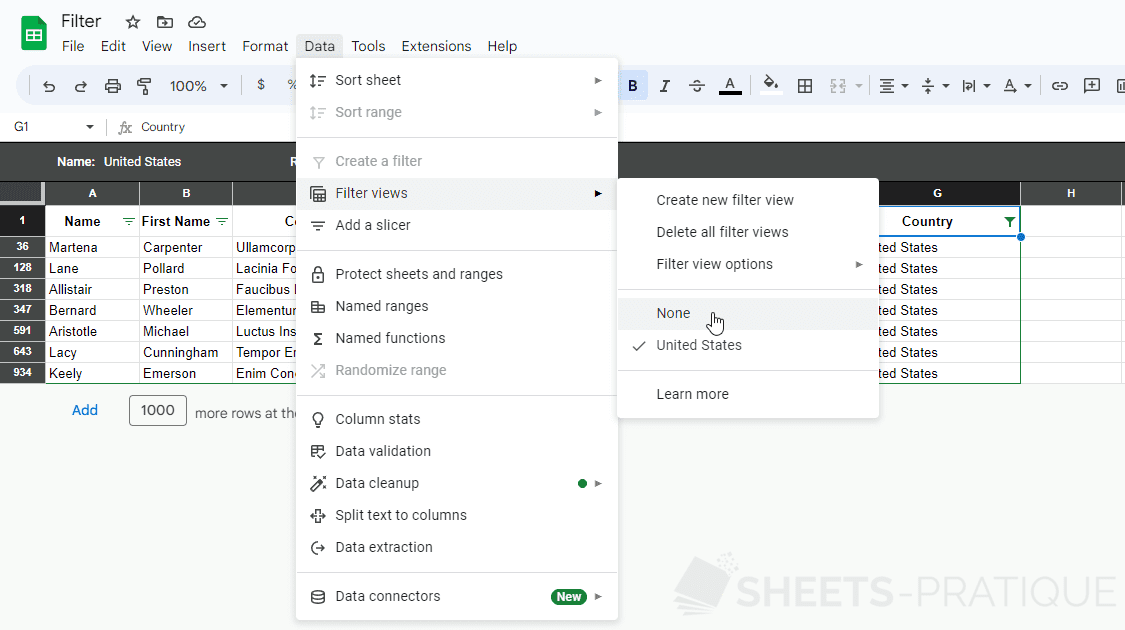
Now exit the filter view by clicking on "Filter views" > "None" in the Data menu:
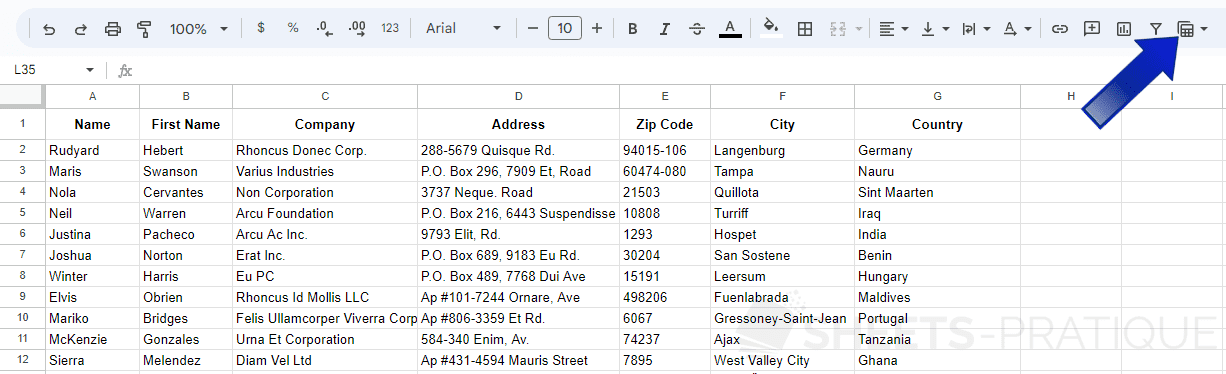
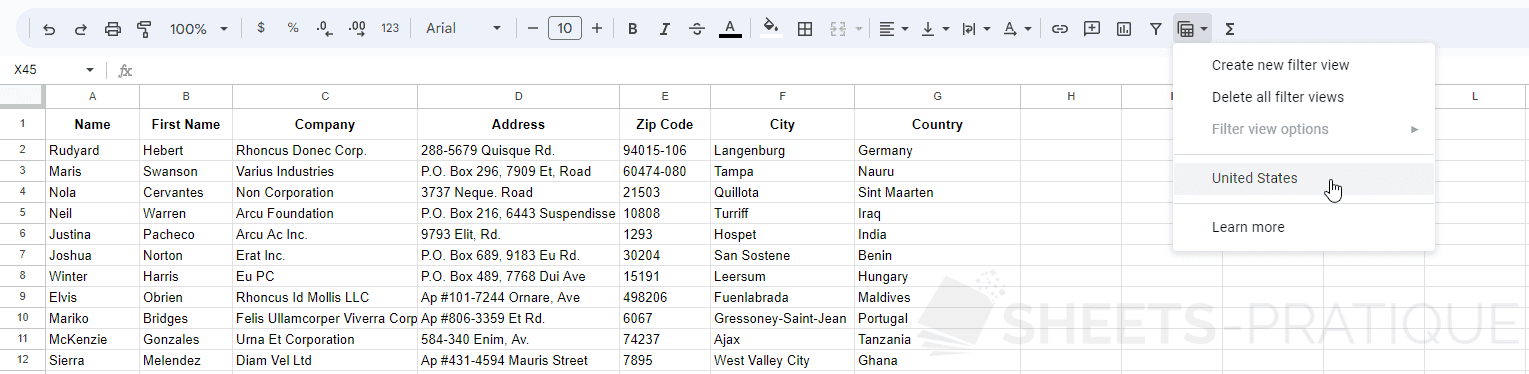
Note that filter views are also accessible from the toolbar:
To display the filter view that you just created again, simply click on its name in the list of filter views:
Then click on "None" to leave the view: